Despite optimal medical therapy and risk modification strategies, coronary events continue to occur. Many individuals with an adverse risk factor profile remain asymptomatic. The quest for detecting patients at risk for a secondary cardiovascular event (cardiac death, and MI) is a high priority. Lipid Rich Plaques (LRP) have been shown to be associated with ACS & MI and can be detected by Near Infrared Spectroscopy (NIRS) imaging.
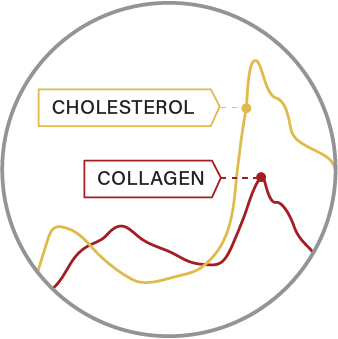
To identify lipids such as cholesterol
Organic molecules have unique spectroscopic signatures that can be used to detect their presence in a mixture of unknown composition. NIRS allows us to distinguish molecules, such as collagen and cholesterol, within the vessel wall and thus identify the presence of LCP.
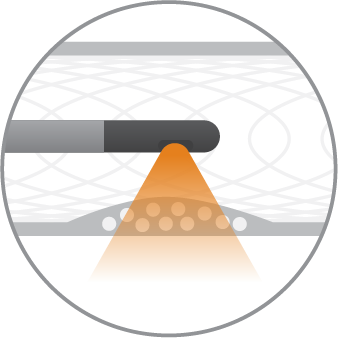
Through blood, tissue and interstitial spaces
The microscopic mirrors at the tip of the Dualpro™ catheter are designed to deliver near-infrared light to the vessel wall and collect the diffusely reflected light. The light propagates through blood and tissue by scattering and absorption, even in the presence of calcium or stents, to interrogate the plaque for its chemical fingerprint.
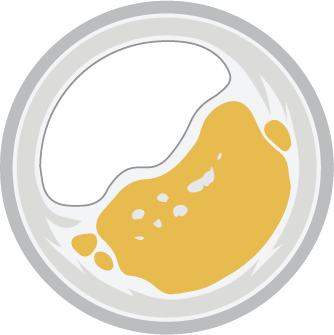
With the aid of advanced algorithms
Advanced algorithms analyze the returned light and calculate the probability of the presence of a lipid core plaque. Our algorithms have been validated in a large prospective histology study providing you with information you can trust.
A chemogram is an automatically generated map of the NIRS signal indicating the LCP location within the vessel wall. This color-coded map can be interpreted quickly, permitting informed treatment decisions.
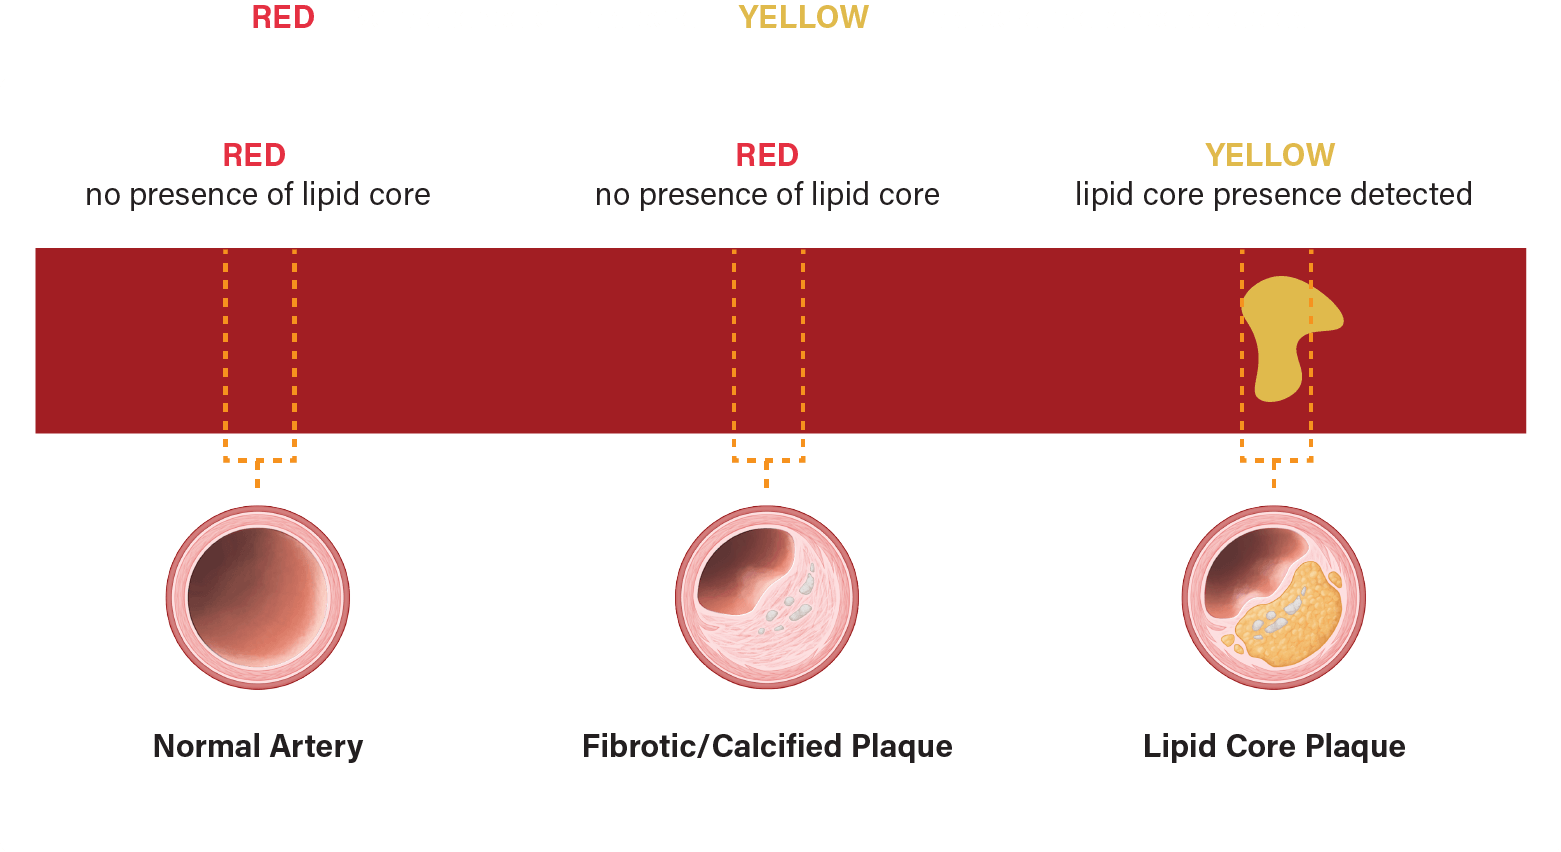
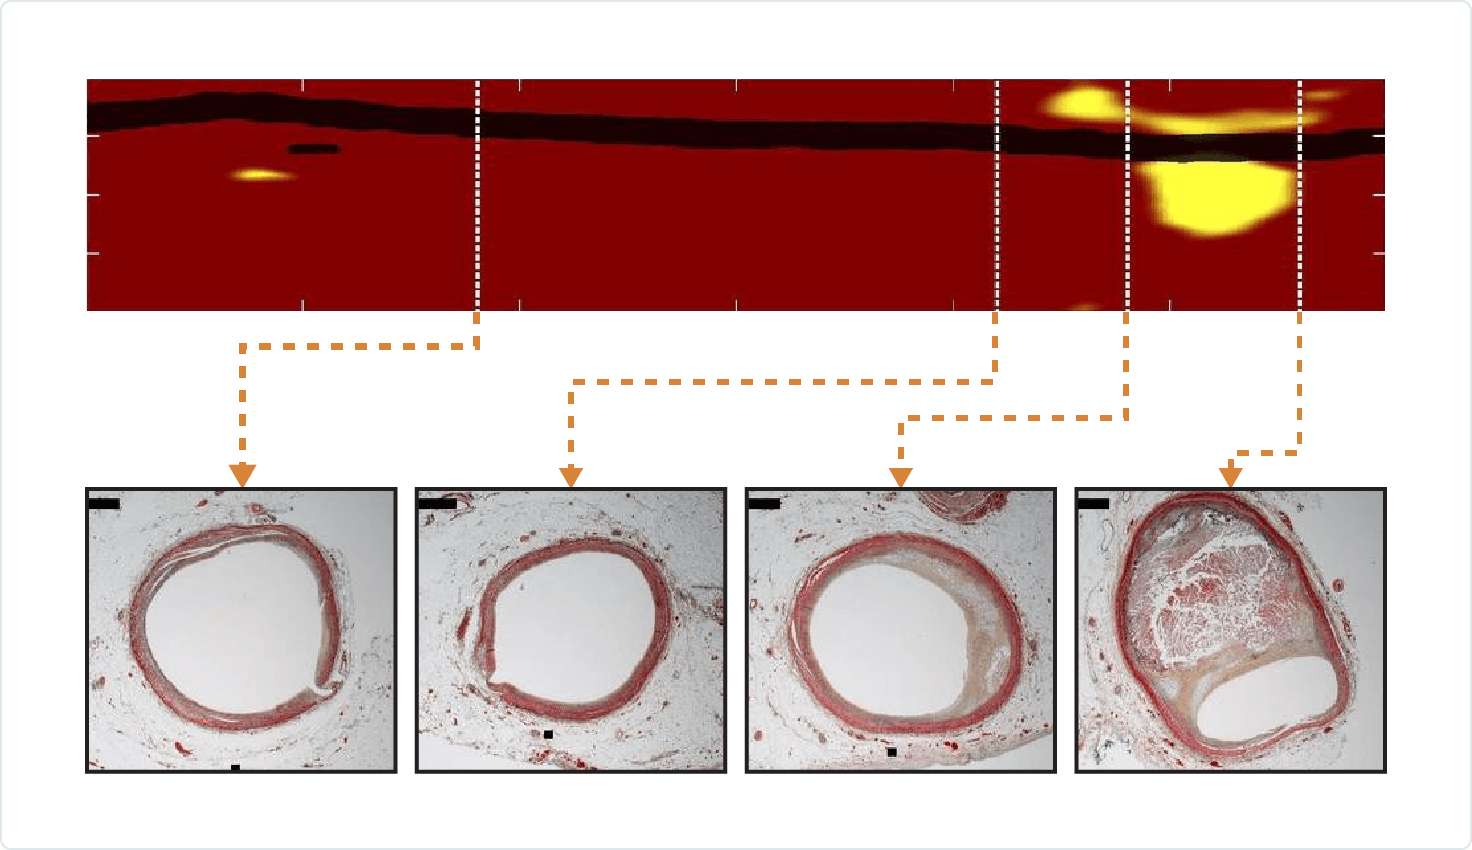
Nearly 2,500 artery cross-sections were histologically and spectrally analyzed to validate lipid core plaque detection by NIRS. The red and yellow colors on the chemogram help differentiate normal or fibrotic plaque that is presumed to be stable from those that contain lipid core plaques.
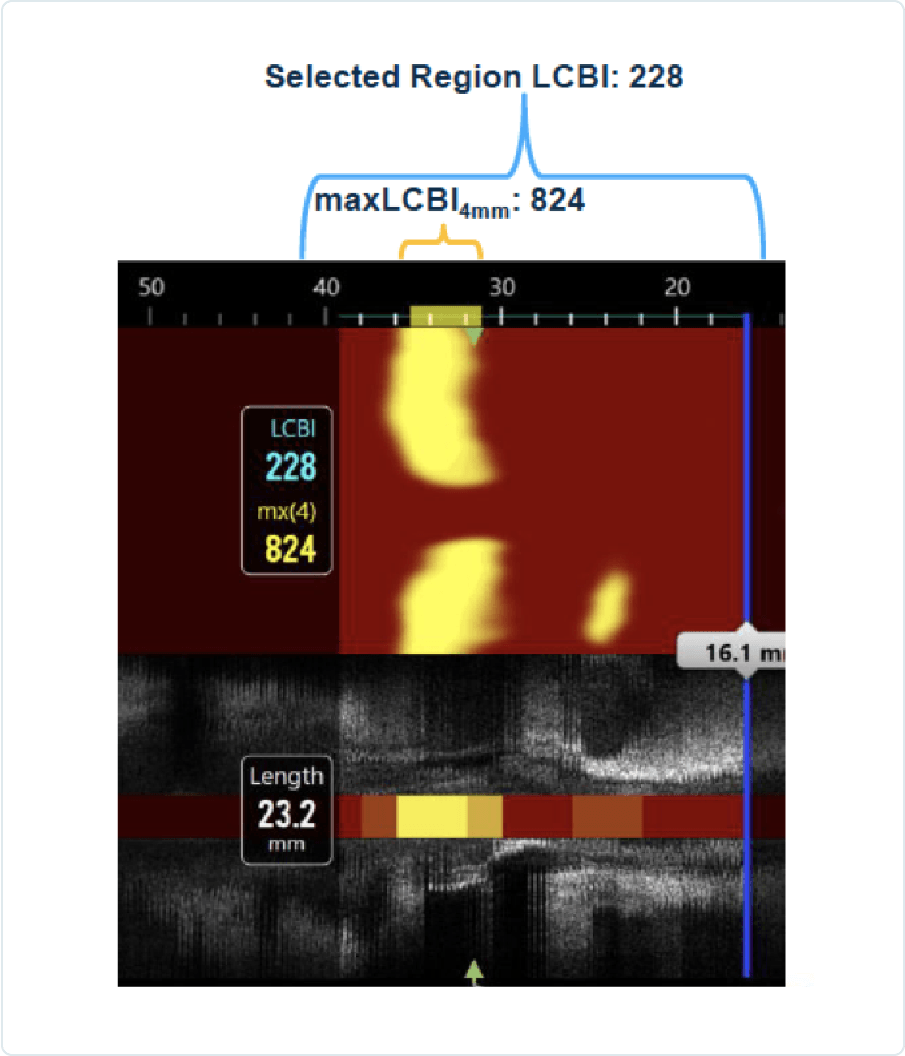
The Lipid Core Burden Index (LCBI) is validated as quantitative summary metric of the Lipid Core in a scanned or selected region. The chemogram and LCBI are generated by the system automatically.
LCBI scale is from 0 to 1000
LCBI = (Yellow pixels x 1000) / (Total valid pixels)
maxLCBI4mm: The maximum 4mm LCBI value in a scanned or selected region
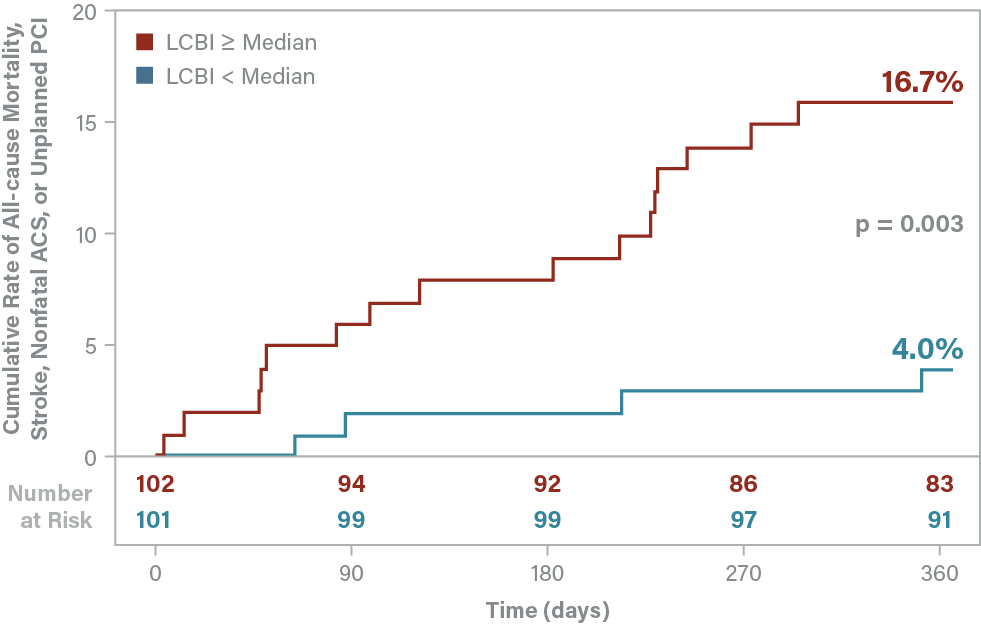
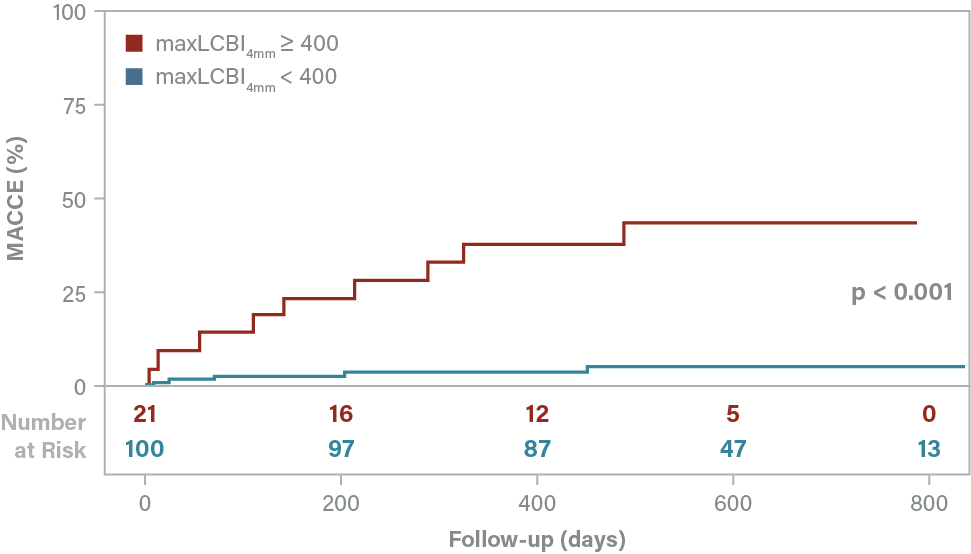
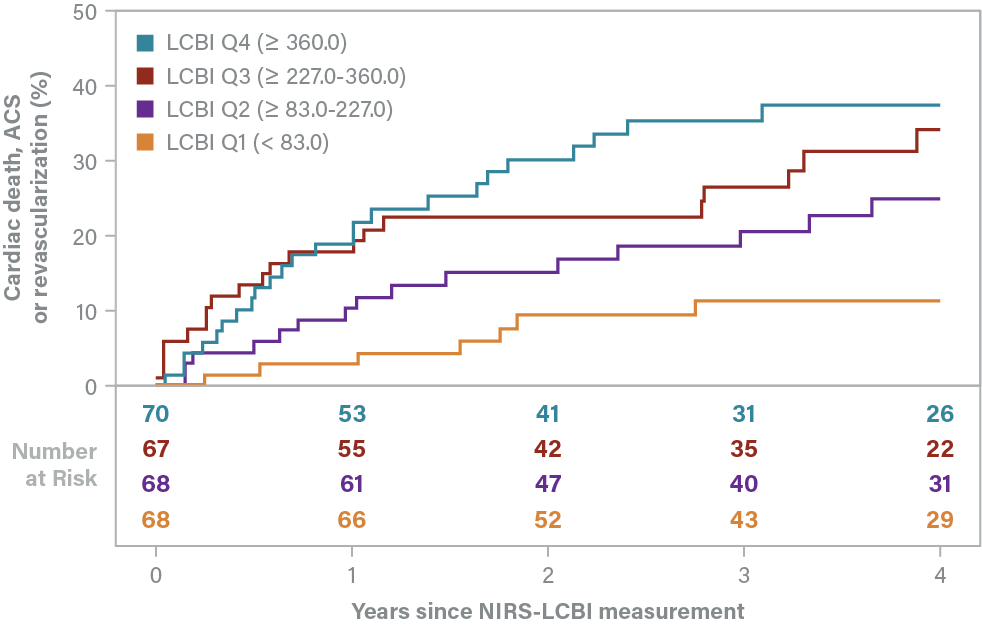
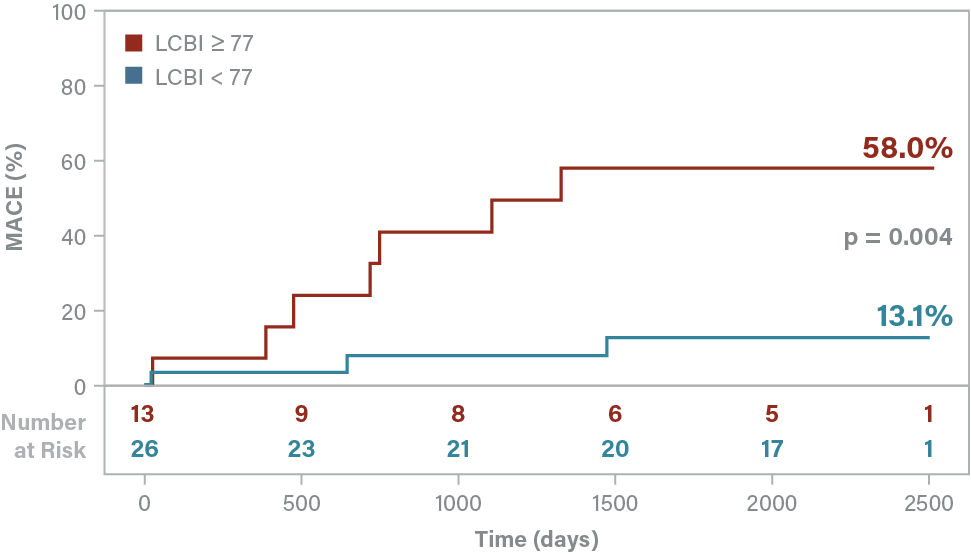
Prior Studies: NIRS Predicts Patient-Level NC-MACE
© 2026 Infraredx™, Inc. All Rights Reserved Powered by Bloom Creative